当社の個人情報保護方針&クッキーポリシー
当社のウェブサイトではクッキーを使用し、ユーザー様のオンライン体験を向上させております。このウェブサイトを立ち上げたときに、クッキーはお使いのコンピュータ上に配置されます。インターネットブラウザの設定を通して、個人的なクッキーの設定を変更できます。
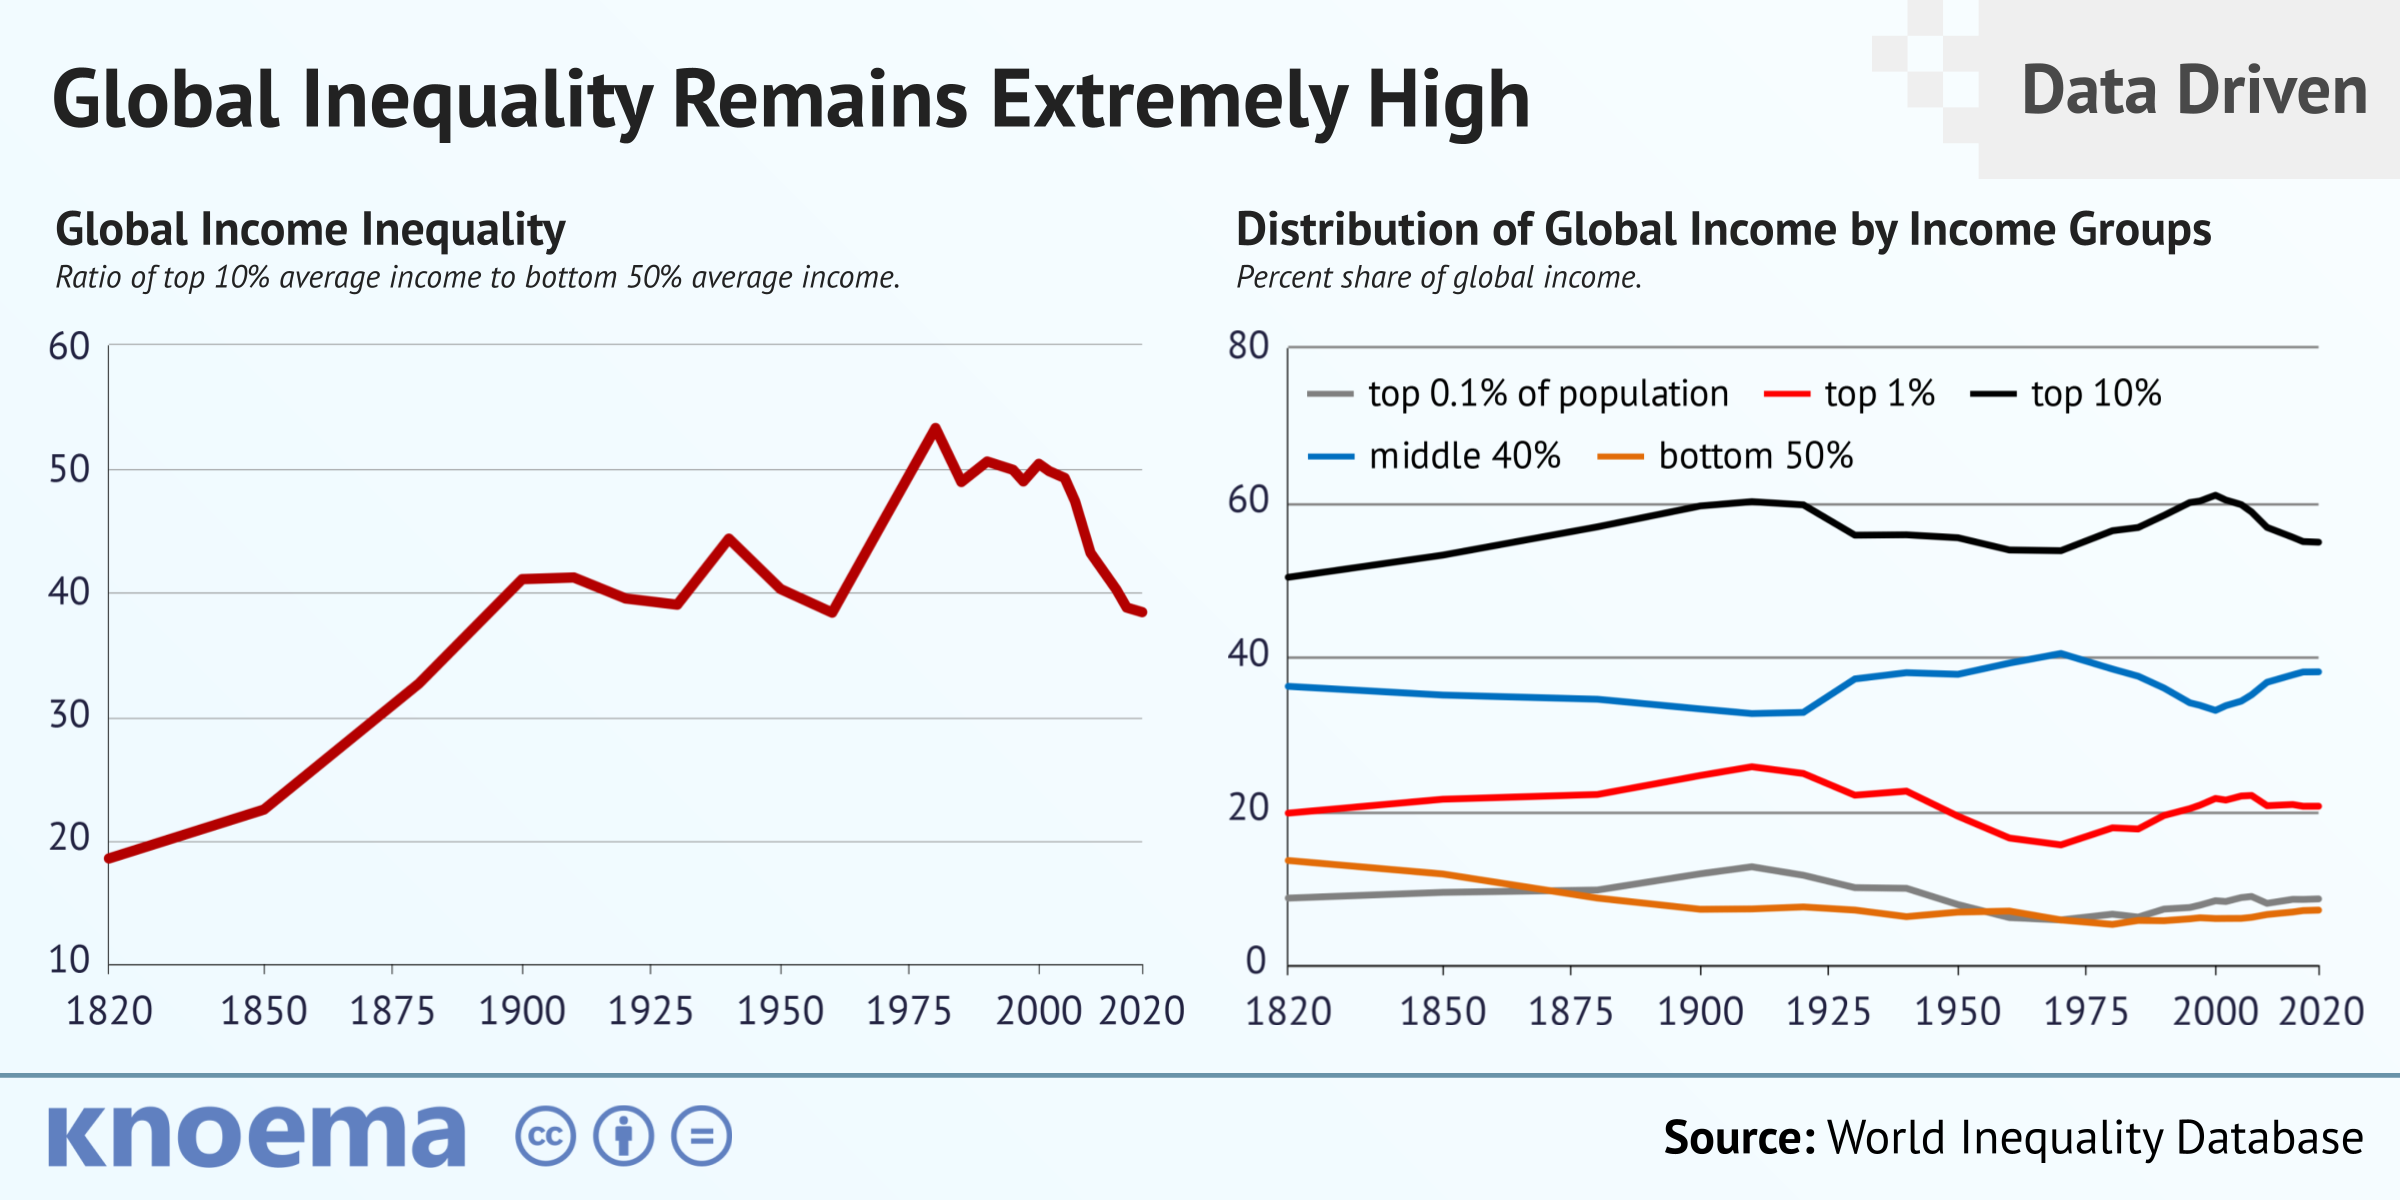
個人情報保護方針(09 September 2021) Inequality in the distribution of income is one of the most important measures of the quality of economic development, along with changes in the overall level of per capita income. However, national statistics offices typically devote much less time and resources to investigating income inequality indicators than traditional economic indicators such as GDP. As a result, official statistics on income inequality are scarce, and inconsistent across countries, making it difficult to measure the evolution of inequality at the global level.
Working with the World Inequality Database, two researchers from the Paris School of Economics — Lucas Chancel and Thomas Piketty – have made a significant contribution toward filling this data gap by constructing world income distribution estimates from 1820 to 2020. Some key findings:
Chancel and Piketty believe decreasing income inequality can be achieved through fiscal revenue sharing, when part of income earned by the richest population is redistributed by government in favor of the poorest poorest. Their estimates show that the U.S. government already redistributes around 7% of national income from the top 10% to the bottom 50% of the U.S. population.
According to the 2019 Forbes Billionaires List, the aggregate wealth of the world's 1,810 billionaires is approximately $8.9 trillion, exceeding the GDP of Japan, the world's third-largest economy with a GDP of $4.4 trillion. In other words, the wealth of 0.00002% of the world's population accounts for 9 percent of the world's GDP of about $74 trillion. How do we measure the net worth of a billionaire? The estimate is based on total asset value, including stakes in public and private companies, real estate, yachts, art, and cash. If a person were a country, we'd measure GDP, which...
A policy decision to increase public transport fares in Chile earlier this month triggered nearly two weeks of mass protests across Chile's largest cities, including the capital city of Santiago. While Chilean President Sebastián Piñera last week announced economic reforms to bring peace to the country - raising pensions, monthly minimum wages, and taxes on the wealthy - the socio-economic deficits of the country have been exposed and the youth mobilized. Prosperity for Chile is real and measurable ... At the end of the 20th century, Chile carried out radical economic reforms....
In 2016, just 1 percent of the world's population owned more than 50 percent of the world's wealth. According to the data from the Credit Suisse Research Institute, inequlity of world wealth continues to grow every year. The Institute's assessment is based on a global analysis of national wealth—defined as the value of the financial assets plus real estate (housing) owned by the households, less their debts—and use of the Gini Index, a traditional measure of income distribution and, thereby, inequality. As noted in the Institute’s report: About 3.5 billion people—or, 73 percent of...
Every poor person in the United States would get a one-time payout of $1,736 if Bill Gates—the richest US citizen—distributed the total value of his assets equally among the US population living below the poverty line. This data is based on analysis from the Robin Hood Index, created by Bloomberg, which compares the net worth of the richest billionaires in 42 countries with the number of individuals below the national poverty line in those same countries to show the theoretical gain to the poor from the distribution of each country's wealthiest citizen. According to the most...
当社のウェブサイトではクッキーを使用し、ユーザー様のオンライン体験を向上させております。このウェブサイトを立ち上げたときに、クッキーはお使いのコンピュータ上に配置されます。インターネットブラウザの設定を通して、個人的なクッキーの設定を変更できます。
個人情報保護方針