当社の個人情報保護方針&クッキーポリシー
当社のウェブサイトではクッキーを使用し、ユーザー様のオンライン体験を向上させております。このウェブサイトを立ち上げたときに、クッキーはお使いのコンピュータ上に配置されます。インターネットブラウザの設定を通して、個人的なクッキーの設定を変更できます。
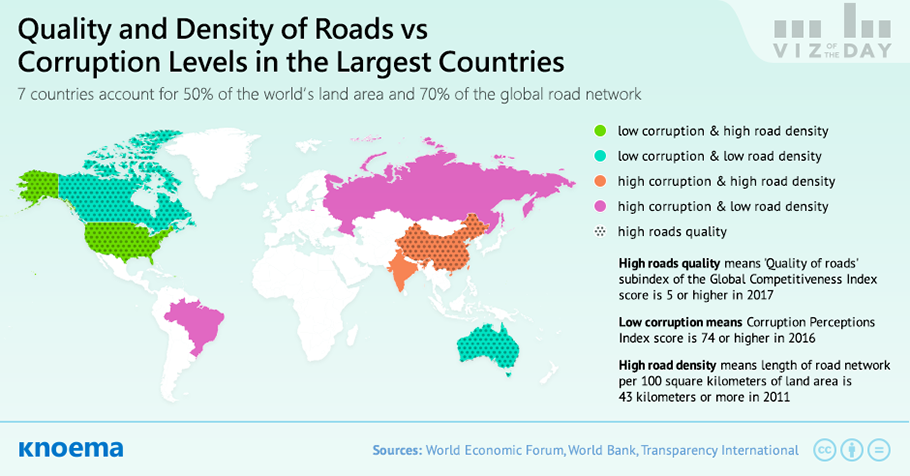
個人情報保護方針Some countries are famous for the quality of their roads (and maybe also the speeds you may go on them). According to the Global Competitiveness Report, the UAE boasts the best roads. France, Hong Kong, Japan, Singapore, and Switzerland also have very high-quality roads—with a ‘quality of roads' score higher than 6—and yet none make the top 100 countries by land area and thus all fall outside the group of countries with the largest road networks.
If large countries with expansive road networks struggle to maintain high-quality roads, to what extent is the public maintenance of roadways hampered by corruption? We analyzed data for seven countries, Australia, Brazil, Canada, China, India, Russia, and the United States, which combined account for 70 percent of the global roads network and roughly half of the world's land area.
So, what about corruption and roadways? The data is absolutely inconclusive.
The Automotive Data Brief reviews the most recent data to present an overall picture of the automotive sector. You can find information relating to vehicle production and sales as well as statistics about fuel prices, vehicle stocks, and the electric-vehicle market.
(12 May 2021) In 2020, worldwide motor vehicle production fell sharply, dropping 15.4% from the previous year, because of travel restriction measures and an overall decline in economic activity due to the COVID-19 pandemic. Passenger cars experienced a more significant drop in production than commercial vehicles, with decreases of 16.9% and 11.6%, respectively. This marks the third consecutive year with negative growth in global automotive vehicle production. In contrast, global electric vehicle (EV) sales increased 39% in 2020, to 3.2 million units, boosting the total global EV...
The United States is often criticized for its perceived nonchalance toward air pollution despite persistent statements to the contrary by the current presidential administration. The US remains the number one contributor globally to harmful chemicals in the air, with the fossil-fuel consuming transportation industry being a primary emission source. With more than 250 million vehicles on US roads, the US surpasses even China based on total vehicles in use despite China's much larger population...at least for now. China has already surpassed the US in annual new car sales. Examining...
Electric cars constitute less than 0.1 percent of the vehicle market today, but market and regulatory forces all but ensure electric vehicles will be the future of the auto industry. According to the 2016 Global Electric Vehicle Outlook from the International Energy Agency, the global electric car stock has grown rapidly since 2010, from about 2,000 cars in 2005 to nearly 1.3 million in 2015. The boom in the electric car industry is usually attributed to three factors: The increasing recovery cost globally for fossil fuels used in conventional vehicles;The environmentally-friendly...
Even as the design of cars become increasingly safety focused and even automated, speed, texting, and driving while under the influence contribute to a rising number of deaths from motor vehicle crashes, particularly in the United States. Asian car manufacturers nearly swept the 2016 motor vehicle safety rankings by the US Insurance Institute for Highway Safety (IIHS), securing nine of the top 10 spots. Only Daimler's (Germany) Mercedes-Benz GLE-Class joined Toyota, Hyundai, Subaru, and Honda in the top 10. The IIHS testing of new cars in the North American market covered three...
当社のウェブサイトではクッキーを使用し、ユーザー様のオンライン体験を向上させております。このウェブサイトを立ち上げたときに、クッキーはお使いのコンピュータ上に配置されます。インターネットブラウザの設定を通して、個人的なクッキーの設定を変更できます。
個人情報保護方針