当社の個人情報保護方針&クッキーポリシー
当社のウェブサイトではクッキーを使用し、ユーザー様のオンライン体験を向上させております。このウェブサイトを立ち上げたときに、クッキーはお使いのコンピュータ上に配置されます。インターネットブラウザの設定を通して、個人的なクッキーの設定を変更できます。
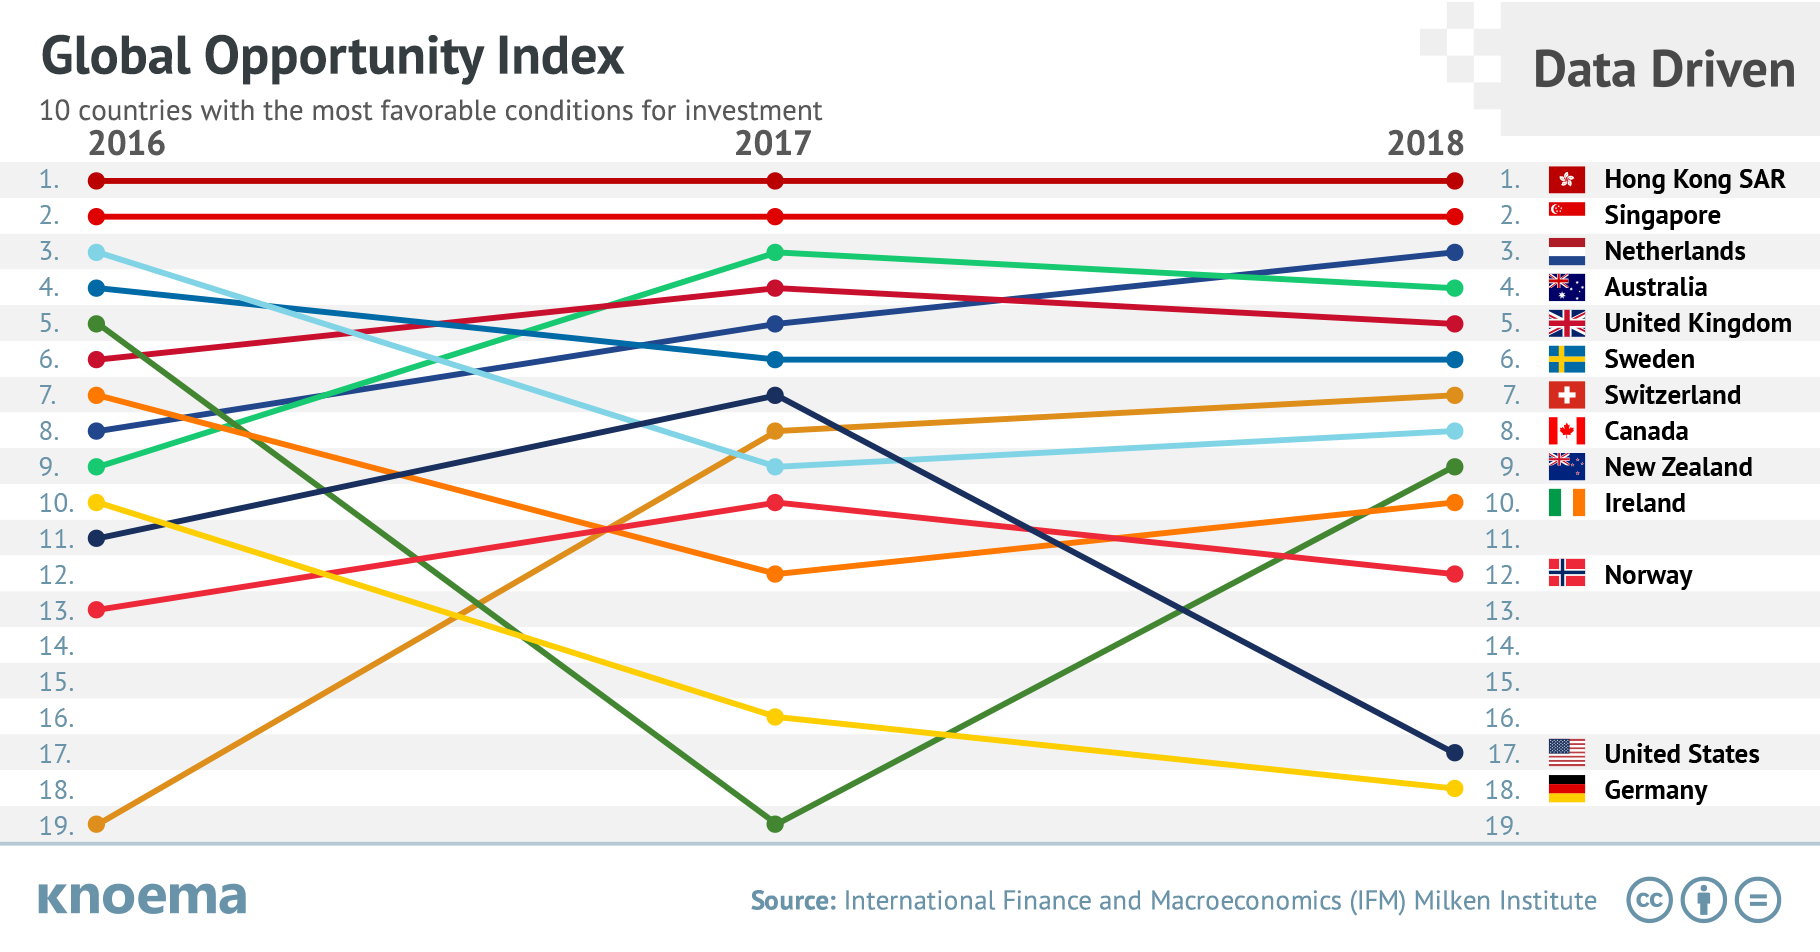
個人情報保護方針Are you investing in the best economies for your industry's footprint? What factors weigh most heavily on your investment decisions? Is your economy improving in areas that matter most to investors? Economists, investors, and other analysts worldwide rely on multi-economy datasets from the likes of the World Bank and IMF as well as indices to make comparisons across time and countries and address these sorts of questions. The Global Opportunity Index (GOI) developed by the Milken Institute delivers one such index to help guide investment decisions and establish baseline estimates for countries seeking to improve their business environments and attract investment. The GOI considers 51 economic and financial factors aggregated across five categories:
The annual Global Opportunity Index provides a snapshot of the fundamental factors attributed to a strong business environment and exposes some potentially surprising results.
The Washington, DC-based International Consortium of Investigative Journalists (ICIJ) has released a database of the so-called Panama Papers - information leaked primarily from Mossack Fonseca, one of the world's leading global law firms providing services of incorporation of offshore entities and headquartered in Panama. The leak is the largest ever of offshore financial records and contains about 11.5 million legal and financial records dating back more than 40 years. The files expose more than 213,000 offshore entities created in 21 jurisdictions, stripping away the secrecy from...
On Monday (24 August), global financial markets suffered heavy losses. Markets started to show weakness earlier this summer, weighed down by concerns about a slowdown of China's economy and fears of economic contagion from a potential Greek exit. On Monday morning, Chinese government efforts to inject liquidity to support the tumbling market failed. China's Shanghai Composite Stock Index closed the trading session with a record 8.5 percent loss, erasing all gains made since the start of the year. European stocks, commodities, and emerging markets were all quick to follow the...
The analysis of yield curve may well help to predict upcoming economic recession. Yield curve shows how interest rates of debt (usually government bonds) change with the increase of its term to maturity. Usually it is considered by investors that lending money for the long term is more risky than lending for the short term, as it is harder to make any predictions for the longer time horizon, i.e. how the world will change say in 10 years. That is why long-term interest rates are usually higher than the short-term ones. Note, "usually" means “in good times” or when people have...
Dow Jones Industrial Average (DJI) along with S&P 500 and NASDAQ Composite indices is one of the most widely quoted benchmark indices in the world which is considered to be a barometer of the US economic status. The index tracks the performance of 30 large publicly traded companies (or blue chips) based in the United States using price-weighted average metric. Companies, included in the index are listed on the New York Stock Exchange (NYSE) and NASDAQ. Only stocks of companies which has the excellent reputation, demonstrate sustained growth and are of interest to a large number...
当社のウェブサイトではクッキーを使用し、ユーザー様のオンライン体験を向上させております。このウェブサイトを立ち上げたときに、クッキーはお使いのコンピュータ上に配置されます。インターネットブラウザの設定を通して、個人的なクッキーの設定を変更できます。
個人情報保護方針