当社の個人情報保護方針&クッキーポリシー
当社のウェブサイトではクッキーを使用し、ユーザー様のオンライン体験を向上させております。このウェブサイトを立ち上げたときに、クッキーはお使いのコンピュータ上に配置されます。インターネットブラウザの設定を通して、個人的なクッキーの設定を変更できます。
個人情報保護方針(30 July 2021) What drives economic growth? Economists give a variety of answers to this question, ranging from cheap labor or endowment with ample natural resources to institutional environment and the development of digital technologies. The answer policymakers choose determines economic policy, which ultimately affects how different sectors of the economy develop.
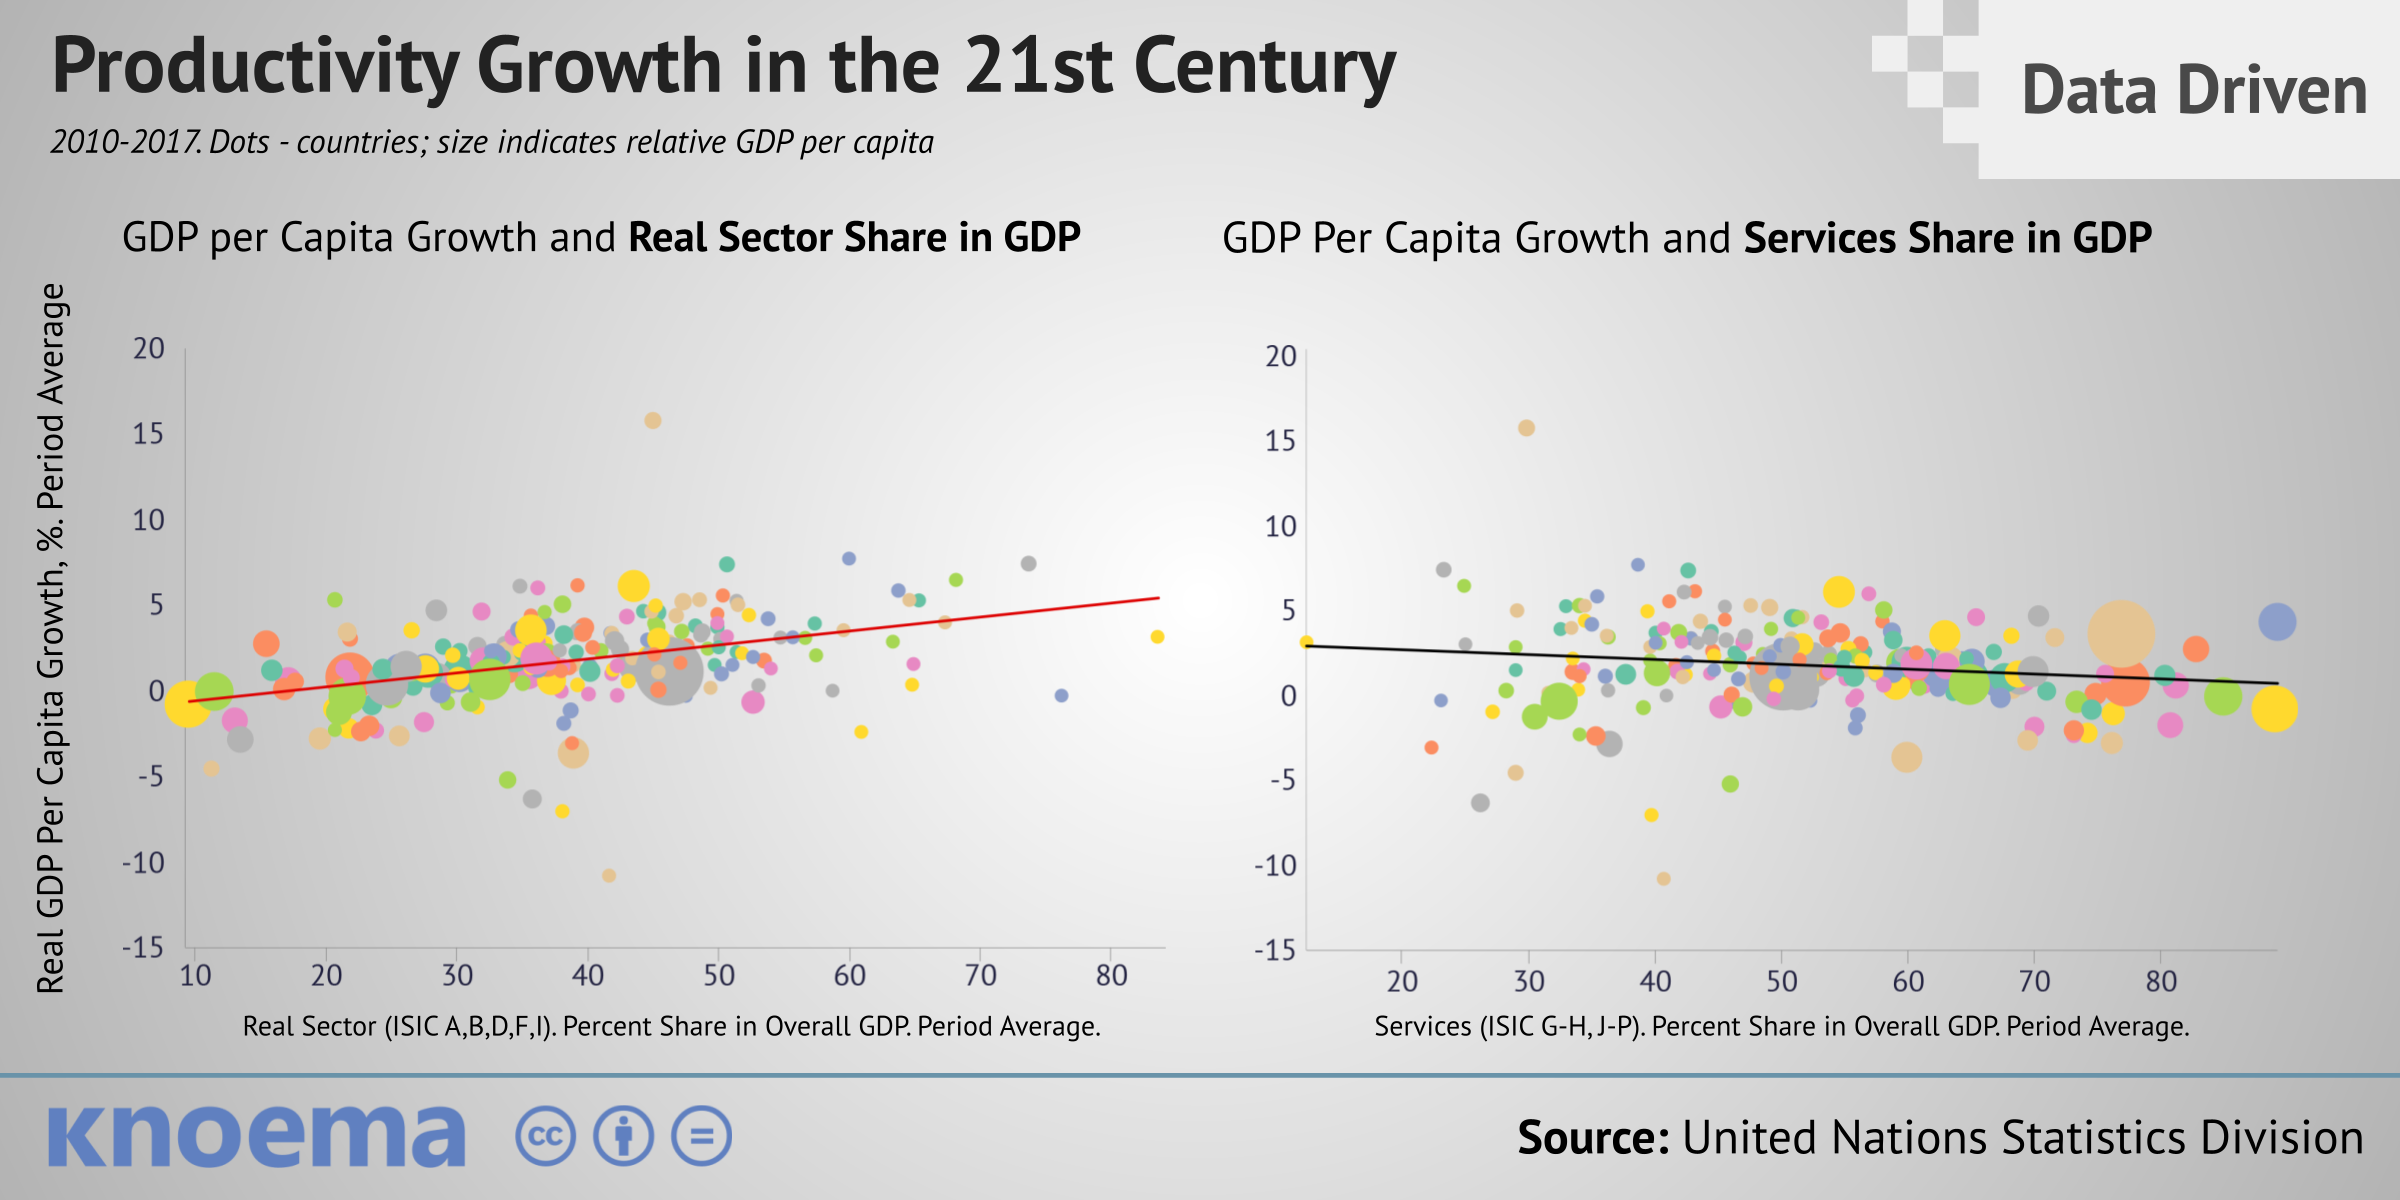
Since the industrial revolution, development of the real sector (which includes agriculture, manufacturing, construction and transportation) has been the key to rapid growth in productivity and fast economic growth. Today the real sector's share in most countries' GDP has substantially declined, while the service sector, even in many low-income countries, accounts for the largest share of GDP. The question for economic policy today is: Can the service sector, which includes trade, business, professional, and government services as well as healthcare and education, play the same role today as the real sector did in the past as an engine for economic growth?
Some economists insist that deindustrialisation doesn't affect economic growth negatively, since the real driver of growth is now the service sector. Let's look at what data shows.
In this dashboard, we investigate which major sectors of the economy drive the growth of per capita income — a proxy for productivity, which, together with the growth of population, determines overall economic growth. We focus on productivity here because this component of growth is susceptible to the influence of economic policy, while government policy is less likely to significantly influence demographic trends.
On the one hand, this result is expected. By its very nature, the service sector provides less opportunity for productivity growth: how do we increase the productivity of a school teacher who graduates 60 students each year throughout his or her working life? Accurate measurement of productivity in many service industries is a major headache for economists. On the other hand, it is interesting to note that despite all the expectations that the services sector can be an "unlimited" source of high-paid jobs creation, real sector seems to constitute the strongest basis for sustained productivity growth.
Live data and insights on Coronavirus around the world, including detailed statistics for the US, EU, and China — confirmed and recovered cases, deaths, alternative data on economic activities, customer behavior, supply chains, and more.
In August, US manufacturing activity contracted 2.1 points from July, the largest contraction in nearly three years. According to the Institute of Supply Management (ISM) Purchasing Manufacturing Index (PMI) - commonly referred to as the ISM manufacturing index - fell to 49.1, making the US a late comer to a growing club of large economies, such as China, the Eurozone, Japan, and the United Kingdom, that have likewise reported contracting manufacturing sectors in recent months. The PMI is being dragged down by a sharp decline in new orders, non-farm employment (which increased by...
Which is the world's largest economy, China or the United States? As is usual in the field of economics, “It depends.” It depends on the methods used to estimate the size of an economy and to compare one economy to another. Despite modern discussions on refining the calculation of gross domestic product (GDP), the standard measure of an economy’s size and performance, to be more inclusive of economic factors that have been ignored to date, such as environmental and natural resource depletion, there is no commonly accepted alternative to GDP. There are, however, at least two commonly...
For the first time during the post World War II era, the global economy is expected to shrink due to measures in force worldwide to suppress the coronavirus, according to the IMF World Economic Outlook (WEO) released on April 14, 2020. In this edition of the WEO, the IMF shortened the forecast horizon to 2021 instead of the expected 2025 horizon and limited the number of indicators available in its statistical tables because of the high level of uncertainty in current global economic conditions. In the baseline scenario—which assumes that the pandemic fades in the second half of...
It sounds like a riddle: how many Big Macs for your entire daily wage? Granted, many of our readers may not even have access to a Big Mac where they live (not to mention those who wouldn’t buy Big Macs if they were vegetarian, among other reasons). So, why is the Big Mac Index from the Economist a well-known concept around the world? It’s simple: Big Macs are easier for the overwhelming majority of the world’s population to understand as opposed to economic concepts like “GDP per capita in purchasing power parities,” which is a mouthful and a complicated concept. The answer to the...
当社のウェブサイトではクッキーを使用し、ユーザー様のオンライン体験を向上させております。このウェブサイトを立ち上げたときに、クッキーはお使いのコンピュータ上に配置されます。インターネットブラウザの設定を通して、個人的なクッキーの設定を変更できます。
個人情報保護方針